

Key Takeaways
- Underperformance is usually a stack of small losses (shade, dust, a weak string, a loose lug) rather than one dramatic fault.
- Start with data, not a ladder: compare your inverter's numbers against a realistic expected yield before you touch anything on the roof.
- A clamp meter and the inverter's own per-string readings will find most problems faster than guesswork.
- Some "faults" are just seasonal physics, temperature derating, or a wrongly-set expectation, so know your baseline first.
- Document each change and re-measure, so you know which fix actually moved the needle.
When I first started diagnosing solar underperformance on my own rooftop system, I assumed something had failed. It hadn't. My 5 kW array was quietly leaking maybe 12 to 15 percent of the output I expected, and the cause turned out to be three small things adding up, not one broken part. In this case study I will walk you through exactly how I found each culprit, the cheap tools I used, and the order I checked things in so you do not waste a Sunday on the roof. You will learn how to build an honest baseline, read your inverter's data, and separate real faults from ordinary physics.
How I Knew Something Was Actually Wrong
My first clue was not a warning light. It was my electricity bill creeping up over two billing cycles while the weather stayed sunny. That nudged me to actually open the inverter app instead of glancing at it.
I pulled a month of daily generation and compared it against a rough expected figure. A well-behaved 5 kW system in my part of India should produce somewhere around 4 to 4.5 units per kW on a clear day. I was seeing closer to 3.4. That gap was consistent, not random, which told me this was a standing problem and not a cloudy week.
The lesson I keep repeating to homeowners: a single bad day means nothing. A repeatable shortfall against a sensible baseline is what you chase.
Tip: Before blaming your panels, work out your realistic expected yield. As a rough rule, multiply your system size in kW by 4 to 4.5 for a clear day in most of India. If you are within 10 percent of that, you may not have a fault at all, just an optimistic expectation.
Building an Honest Baseline First
Over a few installs I noticed that most "my solar is broken" calls are really expectation problems. So the first thing I did on my own system was write down what good looks like for my exact setup, season, and roof tilt.
I noted the panel wattage, the number of panels, the inverter rating, and my roughly south-facing tilt. Then I checked the season. This was late April, so high ambient heat was going to derate the panels a little, and I factored that in before deciding anything was faulty.
With that baseline written down, my measured 3.4 units per kW was clearly low even after allowing for heat. That is what justified climbing onto the roof. If you skip this step, you can spend a weekend fixing a system that was fine.
My Underperformance Case Study, Step by Step
Here is the exact sequence I followed. I deliberately went from data to hardware, cheapest and safest checks first, so I only got on the roof once I had a reason to.
- Compared 30 days of inverter generation against my written baseline to confirm a real, repeatable shortfall.
- Opened the inverter's per-string view and looked for one string producing noticeably less than the others.
- Walked the roof at mid-morning and again near noon to catch moving shadows the data alone would not explain.
- Inspected panel surfaces for dust, bird droppings, and the tell-tale outline of pollen and grime near the frames.
- Used a clamp meter on the DC strings and checked AC-side voltage to spot a weak string or a loose connection.
- Re-torqued the suspect terminal, cleaned the panels, and re-measured over the next three clear days.
Each of those steps either cleared a suspect or flagged one. The whole point of the order is that you never do risky roof work to solve a problem the data could have explained from your sofa.
Culprit One: A Shading Pattern I Had Never Noticed
When I commissioned this system I had checked for shade at noon and it looked clean. What I had missed was a neighbour's water tank that threw a hard shadow across the bottom row of one string for about ninety minutes each morning.
Because those panels were in series, that partial shade dragged the whole string down far more than the shaded area alone would suggest. The per-string data made it obvious: one string sagged badly for a chunk of the morning, then recovered. That is the fingerprint of moving shade, not a dead panel.
Culprit Two: Dust and Grime Worse Than It Looked
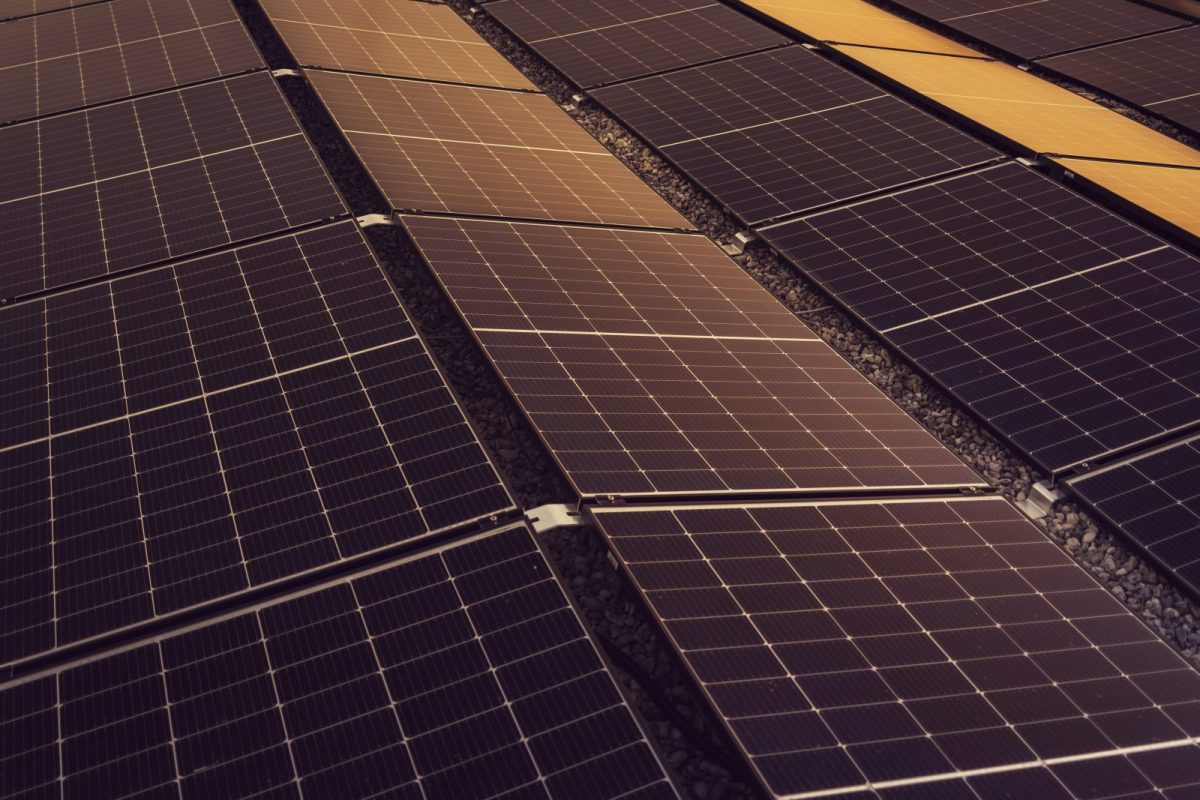
From the ground the panels looked only mildly dusty. Up close there was a fine, sticky film of pollen and road dust, heaviest along the lower frame edge where rain never fully rinsed it. In a dry, dusty stretch this alone can quietly cost several percent.
A gentle wash with plain water and a soft brush, early in the morning while the glass was cool, brought back a visible bump in output the very next clear day. No chemicals, no pressure washer, just water and patience.
Culprit Three: A Slightly Loose DC Connection
The last one was the sneaky one. Clamp-metering the strings, one read a touch low and its junction felt marginally warm to the back of my hand. A connector had worked slightly loose over a couple of years of thermal cycling.
A loose DC joint adds resistance, wastes energy as heat, and in the worst case becomes a fire risk. This is the point where I stopped being a curious homeowner and treated it with respect. I isolated the system before touching anything on the DC side.
Safety warning: Solar DC strings stay live whenever there is daylight and can carry lethal voltage even when the inverter is off. Never open DC connectors or re-torque lugs on a live array. Isolate at the DC switch, verify with a meter, and if you are not confident working with mains and DC wiring, call a qualified installer. A warm connector is a warning sign, not a DIY dare.
The Tools That Actually Earned Their Place
You do not need a lab. Almost everything here came down to reading data carefully and owning one decent clamp meter. The table below is the honest short list I would hand a friend.
| Tool or check | What it finds | Rough cost in India |
|---|---|---|
| Inverter app or portal | Daily yield, per-string drops, error codes | Free with your system |
| DC-rated clamp meter | Weak strings, uneven currents, loose joints | Around 1,500 to 4,000 |
| Soft brush and water | Dust and grime losses | A few hundred |
| Your own eyes at two times of day | Moving shade patterns | Free |
| Non-contact thermometer (optional) | Hot connectors and hot spots | Around 800 to 2,000 |
What the Fixes Actually Recovered
I will not pretend I logged this to two decimal places, because I did not. But directionally the story was clear across the next week of clear days.
Cleaning gave the quickest, most visible jump the very next morning. Re-torquing the loose connection steadied that one weak string so it tracked its siblings again. The shade was the one I could not fully fix without moving panels, so I noted it as a known, understood loss rather than a mystery. That last mindset shift matters: a loss you understand is a solved problem, even if you choose to live with it.
If you want a structured version of this same hunt, I laid it out as a checklist in our guide on solar low-output troubleshooting, step by step, which pairs well with this story.
Mistakes I Nearly Made
My first instinct was to blame the inverter and start pricing a replacement. That would have been an expensive wrong turn. The inverter was doing its job; it was faithfully reporting a problem that lived on the DC side and on the glass.
I also almost skipped the baseline and jumped straight to the roof. If I had, I might have "fixed" a system that was mostly healthy and never found the loose joint. Slowing down to measure first is the single habit that saved me. For the traps I see most often, see our roundup of common solar maintenance mistakes to avoid.
Keeping connections tight, glass clean, and shade understood does more than recover a few units today. It genuinely helps with extending your solar system's lifespan, because heat and neglect are what age hardware early.
For the official view on rooftop solar performance and net metering in India, the Ministry of New and Renewable Energy is a solid, non-commercial reference, and the National Renewable Energy Laboratory has excellent background on how shade, soiling, and temperature affect yield.
Frequently Asked Questions
How do I know if my solar system is underperforming or just having a cloudy spell?
Compare at least two to four weeks of inverter data against a realistic expected yield, roughly 4 to 4.5 units per kW on clear days in India. A single dull day means nothing. A repeatable shortfall of more than about 10 percent on clear days points to a real fault worth chasing.
Can dust really reduce solar output by a noticeable amount?
Yes, especially in dry, dusty regions or near roads. A sticky film of pollen and grime, heaviest along frame edges where rain does not rinse, can quietly cost several percent. A gentle early-morning wash with plain water and a soft brush usually restores most of that lost output.
Why does shading one panel drop the whole string so much?
Panels in a string are wired in series, so current is limited by the weakest panel. When shade hits even one row, it throttles the entire string far beyond the shaded area alone. Per-string inverter data shows this as one string sagging and recovering as the shadow moves.
Is it safe to check DC connections myself?
Only with real caution. DC strings stay live in any daylight and can be lethal even with the inverter off. Never open connectors on a live array. Isolate at the DC switch, verify with a meter, and if you are not fully confident with mains and DC wiring, hire a qualified installer.
What is the cheapest tool that finds the most problems?
Your inverter's own data, which is free. It reveals daily yield, per-string differences, and error codes before you spend anything. After that, a DC-rated clamp meter, roughly 1,500 to 4,000 rupees, will catch weak strings and loose joints that the app alone cannot pinpoint.
Bringing It Together
Diagnosing my own underperformance taught me that the fix is rarely heroic. It was shade I had underestimated, grime I had underrated, and one tired connector, each small, together meaningful. Work from data to hardware, respect the DC side, and re-measure every change so you know what worked. If you want the full framework behind this story, start with our complete guide to solar troubleshooting, and if you would like to know who is behind this advice, our about page tells you. Go read your inverter data this week, you may be surprised what it has been quietly trying to tell you.