


Key Takeaways
- A solar monitoring system tells you how much your panels are generating in real time, so a dead string or a dirty array does not quietly cost you money for weeks.
- Generation-only monitoring comes free with most inverters; adding current transformers (CTs) unlocks consumption and net-export data, which is what actually maps to your electricity bill.
- Judge health with the performance ratio, not raw kWh numbers, because output naturally rises and falls with sun, season, and temperature.
- Set up underperformance alerts on day one; a portal you never open is not monitoring, it is decoration.
- For Indian rooftops, monitoring is your evidence when you raise a net-metering dispute or an AMC warranty claim.
A good solar monitoring guide should do one thing above all else: help you notice when your system stops earning its keep. I have commissioned enough rooftop systems across India to know that the silent failures are the expensive ones. A panel string trips off, a fuse blows, an inverter derates in the summer heat, and nothing feels wrong until the bill arrives. Monitoring is how you catch that in days instead of months. In this guide you will learn what solar monitoring actually measures, how generation and consumption monitoring differ, which numbers matter, how to set alerts that reach you, and the mistakes that quietly waste people's money.
What Solar Monitoring Actually Does
At its core, solar monitoring records how much energy your system produces and, ideally, how much your home uses. Your inverter already measures DC coming in from the panels and AC going out to your loads. Monitoring simply logs those readings, timestamps them, and shows you the story over hours, days, and seasons. Without it, you are flying blind between electricity bills.
The value is not the pretty graph. It is the comparison. When today's curve looks like last week's clear-sky curve, all is well. When it sags, clips early, or flatlines, you have a lead worth chasing. That is the difference between a homeowner who fixes a faulty optimiser in a week and one who loses a full monsoon season of generation.
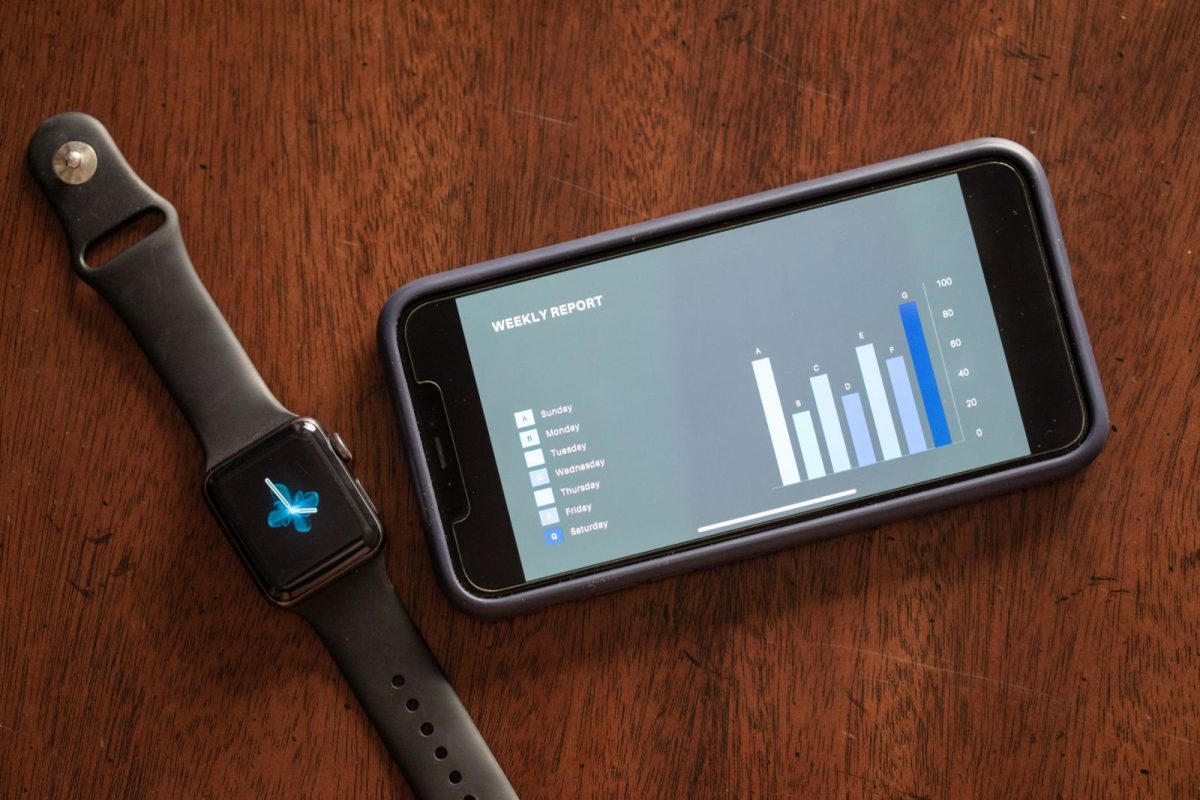
Solar System Monitoring: Generation vs Consumption
This is the single most misunderstood part of solar system monitoring, so let me be blunt about it. There are two different things you can measure, and most people only get one of them by default.
Generation monitoring comes built into almost every modern inverter. It tells you the kWh your panels produced. That is useful for spotting a fault, but it says nothing about how much of that solar you actually used versus exported to the grid.
Consumption monitoring needs extra hardware, usually a pair of current transformers (CTs) clamped around your main incomer. With CTs fitted, the portal can show generation, house load, grid import, and grid export all at once. That is the view that actually explains your bill and your self-consumption ratio. If you want the wiring detail, see our walkthrough on how to add CTs for consumption monitoring.
| Aspect | Generation monitoring | Consumption monitoring (with CTs) |
|---|---|---|
| What it measures | Solar kWh produced | Solar, house load, grid import and export |
| Extra hardware | None (built into inverter) | Current transformers plus a meter/gateway |
| Cost in India | Effectively free | Roughly a few thousand rupees plus fitting |
| Best for | Fault detection, warranty evidence | Bill analysis, self-consumption, load shifting |
| Answers "is my array healthy?" | Yes | Yes |
| Answers "am I using my own solar?" | No | Yes |
Tip: If you are on net metering, generation-only data is fine for checking array health, but consumption CTs pay for themselves fast because they show you exactly which appliances to shift into daylight hours.
How to Monitor Solar Production: The Numbers That Matter
Knowing how to monitor solar production well is less about staring at kWh and more about reading a few signals correctly. Here are the ones I check first on any system.
Daily kWh and the shape of the curve
Raw daily kWh tells you the season is doing its job. The shape of the curve tells you whether the hardware is. A healthy day is a smooth bell that peaks around solar noon. Notches, early clipping, or a flat top can each point to shading, a tripped string, or an undersized inverter. Learning to read that shape is a skill in itself, which is why we wrote a dedicated piece on how to read your solar production curve.
Performance ratio (PR)
Performance ratio is the honest health score. It compares what your system actually produced against what it should have produced given the sunlight that fell on it. A PR in the high 0.7s to low 0.8s is typical for a well-run Indian rooftop; a slow decline over months usually means soiling or a degrading component. Because PR strips out weather and season, it is far more trustworthy than raw kWh. We break the maths down gently in performance ratio in solar, explained.
Yield and seasonal expectation
Specific yield (kWh produced per kWp installed) lets you compare your system against neighbours and against itself across seasons. A 5 kWp system in Rajasthan will out-yield the same system in coastal Kerala, and both will dip in the monsoon. Knowing your normal band stops you from panicking in July. Our guide on understanding daily and seasonal solar yield maps out what to expect month by month.
String vs Microinverter: How Deep Your Monitoring Goes
The granularity of your data depends heavily on your inverter architecture, and this shapes how quickly you can pinpoint a fault. A plain string inverter reports at the string level, so if one panel in twelve is failing, you see a dip but not which panel. Microinverters and DC optimisers report per panel, so a single shaded or cracked module lights up on the map instantly.
| Architecture | Monitoring granularity | Fault-finding speed | Typical cost |
|---|---|---|---|
| String inverter | Whole string | Slower (narrow down by inspection) | Lowest |
| String + optimisers | Per panel | Fast | Medium |
| Microinverters | Per panel | Fastest | Highest |
Neither is simply "better"; it is a trade between upfront cost and diagnostic resolution. If your roof has chimneys, water tanks, or tree shade, panel-level data earns its premium. On a clean, unshaded roof, string-level monitoring is usually enough. We compare the two views in detail in string vs microinverter monitoring compared.
Solar Monitoring Setup: A Simple Starting Path
A solid solar monitoring setup does not need to be complicated. Here is the order I recommend for a new homeowner, from zero to genuinely useful.
- Register the inverter portal. Every major brand (Growatt, Solis, Sungrow, Deye, Enphase and others) ships a free app or web portal. Get the login from your installer and confirm data is flowing.
- Connect the datalogger to Wi-Fi. Most systems use a small dongle. Put it on a stable network with good signal near the inverter, or dropouts will pepper your data with gaps.
- Record a clear-sky baseline. Note a good sunny-day curve in your first week. This is the reference every future "is something wrong?" check compares against.
- Add CTs if you want bill insight. Have a qualified electrician clamp CTs on the incomer for consumption and export data.
- Turn on alerts. Configure email or push notifications for zero-generation and underperformance events so the system nudges you, not the other way round.
If you want the click-by-click version with screenshots, our companion tutorial covers how to set up solar monitoring at home for the common Indian brands.
Safety warning: Fitting CTs means working near your main AC incomer, which carries lethal mains voltage, and inspecting arrays involves live DC. Do not open the meter box, main isolator, or DC combiner yourself. Always use a licensed electrician for anything past the app screen. Read our disclaimer before acting on any electrical guidance.
Alerts: The Feature Most People Skip and Regret
A monitoring portal you open once a month is barely better than no monitoring at all. The whole point is to be told when something is wrong. Every serious platform can send a notification for a zero-generation day, and better ones can flag a system that is producing meaningfully less than its healthy peers on the same weather.
When I commissioned a 6 kWp system for a family in Pune, I set a simple rule: alert me if a weekday shows zero output before 11 am on a clear morning. Three weeks later that alert fired. A rodent had chewed through a DC cable in the conduit. Because the notification reached the owner the same day, we lost one afternoon of generation instead of a fortnight. That single alert paid for the whole monitoring exercise. For the how-to, see how to build solar underperformance alerts.
Choosing an App or Portal
You usually do not choose your monitoring platform in isolation; it comes bundled with your inverter brand. Still, the quality varies enormously. Some portals refresh every five minutes with clean graphs and CSV export. Others lag, log you out, or hide the data behind an installer account you cannot access. Before you buy hardware, look at the app it forces on you.
The features worth checking are: how often it updates, whether you get your own owner login, whether it exports raw data, and whether it supports the alerts described above. We line up the popular options side by side in best solar monitoring apps and portals compared, and cover the underlying hardware in comparing monitoring hardware and data loggers.
Common Setup Mistakes and Persistent Myths
Over a few dozen installs I have seen the same handful of monitoring mistakes repeat. The Wi-Fi dongle placed too far from the router, so data arrives full of holes. The owner login never handed over, so the homeowner cannot see anything without ringing the installer. Alerts left switched off. And the classic: judging the system by raw kWh and panicking every cloudy week. We catalogue these in common solar monitoring setup mistakes.
There is also a lot of folklore. "Monitoring drains my panels." "More sensors mean more failures." "If the app shows a number, the meter must agree." Most of these are simply wrong, and believing them leads people to ignore genuinely useful data. We sort the true from the false in solar monitoring myths vs facts, debunked.
When Monitoring Actually Saves You Money
Let me put a worked example to it. Suppose a 5 kWp system in Gujarat should produce around 20 to 22 units on a clear October day. One string quietly drops out and output falls to about 14 units. Without monitoring, you might not notice for a whole billing cycle, roughly 30 days. That is close to 200 lost units, and at a modest tariff plus lost export credit, easily two to three thousand rupees gone before you even suspect a problem.
With a zero-string alert, you catch it the next morning. The saving is not hypothetical; it is the whole reason the industry logs this data. A real account of exactly this playing out is in how monitoring caught a fault in my solar system.
Monitoring also matters for two very Indian reasons. First, net-metering disputes: if your DISCOM meter and your generation logs disagree, your monitoring data is your evidence. Second, warranty and AMC claims: a documented drop in performance ratio is far more persuasive to a manufacturer than "it feels lower." For the deeper analytics behind those arguments, see advanced solar performance analytics explained.
If you want a broader context on why the government pushes generation-based metering at all, the national programme details on the Ministry of New and Renewable Energy site are worth a read, and the technical primers at the National Renewable Energy Laboratory explain the performance concepts in more depth.
Frequently Asked Questions
Do I need special hardware to monitor my solar system?
No, not for generation data. Almost every modern inverter includes a free app or web portal that shows your solar output. You only need extra hardware, current transformers, if you want to also see your home consumption, grid import, and export figures.
How often should I check my solar monitoring app?
Set up automatic alerts and then a weekly glance is plenty. The alerts catch sudden failures like a tripped string, while a weekly review of the production curve and performance ratio catches slow problems such as soiling or gradual component degradation before they cost much.
What is a good performance ratio for a rooftop system in India?
A well-run Indian rooftop typically sits in the high 0.7s to low 0.8s once you account for heat, dust, and cabling losses. Lower is not automatically alarming, but a steady month-on-month decline in performance ratio usually signals soiling or a fault worth investigating.
Does solar monitoring work during a power cut?
It depends on your setup. The inverter still generates, but the Wi-Fi datalogger needs your router, which is usually dead during an outage. Data buffers locally and uploads once power and internet return, so you lose live view but not the recorded history.
Can monitoring data help with a net-metering dispute?
Yes, and it is one of the most practical reasons to keep good logs. If your DISCOM bill or bidirectional meter disagrees with your generation and export data, your timestamped monitoring records give you concrete evidence to raise the discrepancy with the utility.
Is there more I should read after this guide?
Yes. We keep a running list of reader questions in our solar monitoring FAQ with 15 questions answered, which goes into edge cases like multiple inverters, apartment systems, and third-party monitoring platforms that this overview does not cover.
Conclusion
Solar monitoring is not a gadget for enthusiasts; it is the difference between a system that quietly loses money and one you actually control. Start simple: register your portal, learn your clear-sky baseline, add consumption CTs if the bill insight tempts you, and above all switch on alerts so the system tells you when something breaks. Do that and your panels will keep earning what they promised. If you are just beginning, the natural next step is our friendly walkthrough on how to set up solar monitoring at home, and you can always learn more about who we are on our about page.