


Key Takeaways
- To monitor multiple solar sites from one screen, you either standardise on a single inverter brand's portal or feed every site into a multi-brand aggregator platform.
- A good fleet view shows current power, today's yield, and any fault flags for every site in a single list, so a bad array stands out in seconds.
- Third-party data loggers let you pull mixed-brand sites (a home, a shop, a farm pump) into one dashboard even when the inverters do not match.
- Set alert thresholds per site, not one global rule, or a 2 kW rooftop and a 25 kW shed roof will bury you in false alarms.
- Expect a small recurring cost for cellular SIMs or a premium platform tier once you cross three or four sites.
The first time I had to monitor multiple solar sites, it was three: my own rooftop, my cousin's shop in the next town, and a borewell pump running off a small ground array. I was logging into three different apps every morning, comparing yesterday's numbers in my head, and still missing the day one string on the shop roof quietly stopped producing. It cost that shop about a week of generation before anyone noticed. One dashboard would have caught it the same afternoon. This is how installers, housing societies, and anyone with more than one array pull every site into a single view.
Who actually needs a single fleet view
You do not need fleet-level monitoring for one rooftop. You start needing it the moment you are responsible for two or more arrays that you cannot see from the same window.
The people who ask me about this fall into a few buckets. Small installers looking after 10 to 200 client systems on annual maintenance contracts. Housing societies with panels on several blocks. A shop owner or farmer running solar at home plus a business address. And the growing group of prosumers who added a second system at a parents' house or a weekend property.
In every case the pain is the same: you want one place that answers a single question fast. Is anything broken right now, and where?
How single-portal fleet monitoring actually works
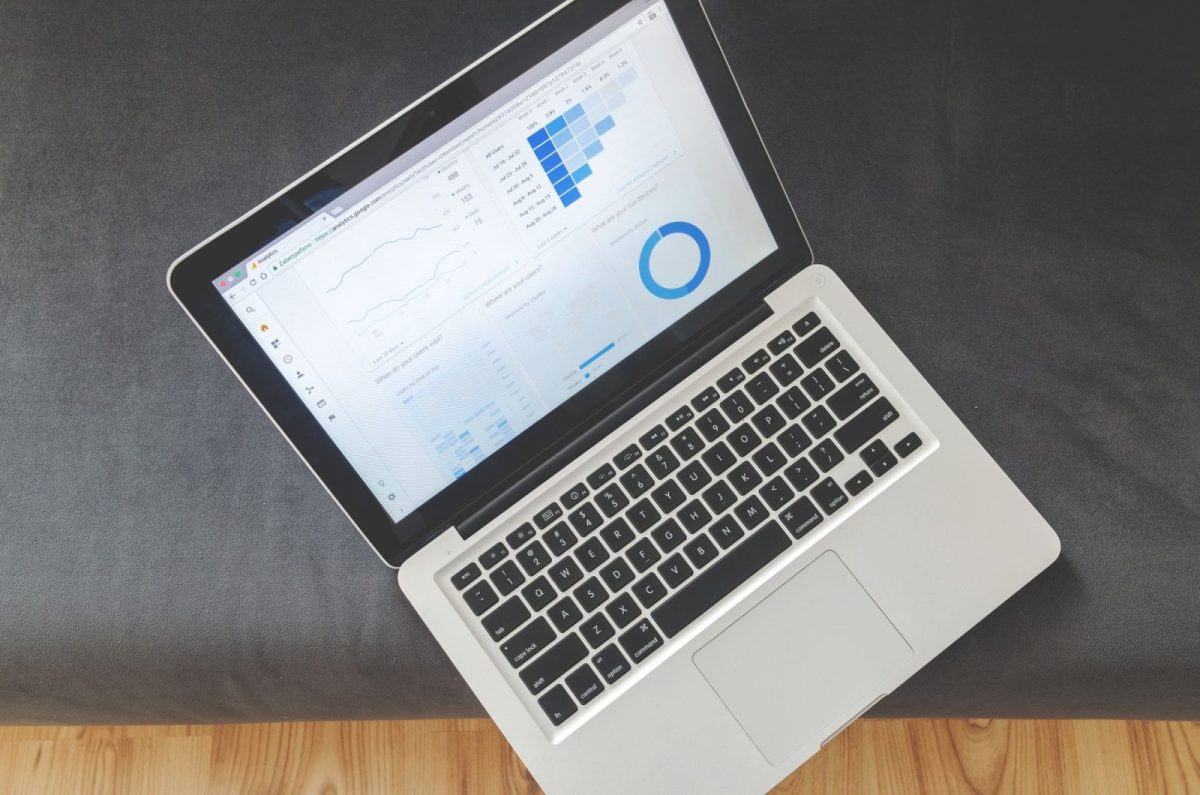
Every solar site already produces data. The inverter measures DC input, AC output, voltage, and fault codes. A monitoring device on that site pushes those readings to a server over the internet. A fleet dashboard is simply a web portal that reads from many of those sites at once and lays them out side by side.
The pieces that feed the portal
- The inverter: the source of truth for production and fault data at each site.
- A data logger or built-in dongle: the Wi-Fi, LAN, or cellular unit that sends readings up to the cloud. If you are unsure which hardware suits mixed sites, my comparison of monitoring hardware and data loggers breaks down the options.
- The cloud platform: the account that stores history and draws the dashboard.
- Your device: a browser or app on your phone that shows the combined view.
When all your inverters share one brand, this is almost free. The manufacturer's portal groups your sites automatically once each is registered under the same login. The friction shows up when the brands do not match, which is where you have to make a choice.
Your options for watching every site at once
There are four practical ways to pull multiple sites together. The right one depends on how uniform your hardware is and how many sites you are running.
| Approach | Best for | Rough cost | Main limit |
|---|---|---|---|
| Single-brand portal | All sites on the same inverter make | Free with the hardware | Locks you into one brand for every future site |
| Multi-brand aggregator platform | Mixed brands, 5+ sites | ₹100-400 per site per month | Recurring fee, setup effort per site |
| Third-party logger plus platform | Old or basic inverters with no cloud | ₹6,000-15,000 per site once, plus SIM | Extra hardware to install and maintain |
| Manual spreadsheet | Two or three sites, tight budget | Free | Reactive, easy to skip, no live alerts |
My honest advice: if you are picking inverters for several new sites, standardise on one reputable brand and let its native portal do the work. If you inherited a mix, an aggregator platform is worth the monthly fee the first time it catches a dead string before your client does.
What a good fleet dashboard should show you
A dashboard that just lists sites is not enough. At a glance, the top-level view should tell you four things for every site without a single click.
- Live power right now, in kW, so a zero on a sunny afternoon jumps out.
- Today's yield in kWh, to compare against what that site should make.
- A status flag: normal, warning, or fault, ideally colour coded.
- Specific yield (kWh per kWp) if the platform supports it, because that number lets you compare a 3 kW and a 30 kW site fairly.
That last metric is the one I lean on most. Raw kWh always makes the big roof look best. Specific yield puts every site on the same scale, so an underperforming small array cannot hide behind a healthy large one. For the deeper metrics behind fleet health, see my notes on advanced solar performance analytics.
Tip: Sort your fleet list by specific yield, lowest first, and check it once a day. The worst performer sits at the top every morning, so a slow decline shows up long before it becomes a total outage.
Setting up a multi-site view: the steps
The exact screens differ by platform, but the sequence is almost always the same. Here is the order I follow when I onboard a new client fleet.
- Confirm every site has a working logger or dongle that is actually online. A dashboard cannot show a site that is not reporting.
- Create one platform account that will own the whole fleet, not one per site.
- Register each site under that account with a clear name, for example "Sharma - Kothrud rooftop 5kW", so you can find it fast.
- Enter the correct system size (kWp) for each site. This is what makes specific yield and expected-yield alerts accurate.
- Set alert rules per site, tuned to that array's size and orientation.
- Add the phone numbers or emails that should receive fault alerts.
- Watch the fleet for a week and adjust thresholds that fire too often or stay silent through real problems.
Step four trips up more people than any other. If you leave the system size blank or wrong, the platform cannot tell a lazy site from a small one, and every clever metric downstream becomes noise.
Reading alerts without drowning in them
The fastest way to make people ignore a monitoring platform is to let it cry wolf. Once you cross five or six sites, a single global alert rule will flood your phone. A passing cloud on one roof, a grid dip on another, and you get ten pings before breakfast.
Tune alerts around what actually needs a human. I keep only three that reach my phone: a site producing zero during peak sun, a communication dropout longer than 24 hours, and a hard inverter fault code. Everything softer, like a mildly low day, I review in the morning list instead of as a push notification. If grid trips are common at a site, my guide to solar grid-fault trips and their causes in India helps separate a real fault from a jumpy grid.
Safety warning: A remote dashboard tells you a site has a fault, not that it is safe to touch. Never let a monitoring alert tempt you or a client onto a roof or into an inverter enclosure to "just check". DC strings stay live in daylight even when the inverter has tripped. Send a qualified technician for any physical inspection, and isolate both AC and DC before anyone opens a cover.
Common mistakes I see with multi-site setups
A few patterns come up again and again when a fleet view is not earning its keep.
- One login per site. If each system lives in its own account, you never get a combined view. Consolidate under one owner account from the start.
- Relying on home Wi-Fi at every site. Household routers get switched off and passwords change. For remote or unattended sites, a cellular SIM logger is far more reliable, which matters even more if a location has patchy connectivity. My guide to solar monitoring without internet access covers the offline options.
- Ignoring export data. On net-metered sites, production is only half the story. Watching how much each site self-consumes versus exports tells you whether the sizing was right, something I cover in detail in how to track self-consumption and export.
- No named owner. A shared dashboard with no one accountable gets checked by nobody. Assign one person to the morning review.
Reliable connectivity is the quiet foundation under all of this. The most elegant dashboard is useless if a site stops phoning home. Government schemes like PM Surya Ghar are pushing rooftop numbers up fast, and monitoring quality is what separates a fleet that stays healthy from one that slowly rots. Independent performance data from NREL shows how much even small, unnoticed faults erode yield over a year.
Frequently Asked Questions
Can I monitor different inverter brands in one dashboard?
Yes, but not through a single manufacturer's portal. You need a third-party aggregator platform, or a universal data logger at each site that reports to a shared account. Same-brand sites are far simpler, so standardise your hardware when you can.
How many sites before I need a paid platform?
Two or three sites are manageable with free native portals or a spreadsheet. Around five sites, the daily login juggling and alert noise usually justify a paid aggregator tier at roughly ₹100 to ₹400 per site each month.
What if a remote site has no internet?
Use a cellular data logger with its own SIM instead of relying on local Wi-Fi. It sends readings over the mobile network, so the site appears in your fleet view even with no broadband on premises. Budget for the recurring SIM cost.
Which metric best compares sites of different sizes?
Specific yield, measured in kWh per kWp. It divides production by system size, so a 3 kW and a 30 kW array land on the same scale. A low specific yield flags an underperformer that raw kWh totals would hide.
How often should I check a multi-site dashboard?
A quick morning scan of the fleet list catches most issues within a day. Beyond that, rely on tuned push alerts for genuine faults so you are not glued to the screen. Once a month, review longer trends for slow degradation.
Bringing it together
Watching several arrays does not have to mean several apps and a nagging feeling you have missed something. Pick one account that owns the whole fleet, feed every site into it with the right hardware, enter accurate system sizes, and tune your alerts so only real problems reach your phone. Do that and one screen quietly replaces a stack of logins. If you want the full picture of how monitoring fits into a healthy solar system, start with our complete solar monitoring guide and build your fleet view from there.